Abstract: Utilization of a CGM-based Dashboard to Identify At-Risk Patients with Type 1 Diabetes (T1D)
Katie Noland1; Britaney Spartz1; Emily DeWit1, Mark Clements1; Rachel Dixon1; Jaimie Contreras1; Gayla Kutzli1; Andie Kaminsky1; Katelyn Evans1; Jude El Buri1
1Children's Mercy Kansas City Kansas City, Missouri, USA
Background/Objective: A continuous glucose monitor (CGM)-based population health dashboard, created by researchers at Stanford University, was adapted and adopted by Children's Mercy. The dashboard flags patients with T1D meeting clinician-defined risk criteria: extreme lows >2%, no alerts, lows >4%, >15% drop-in time-in-range (TIR), TIR <65%, extreme highs >10%, >15% drop in wear time, insufficient data, extreme highs >3%. It enables clinicians to identify patients in high-risk categories for additional support between standard-of-care visits.
Methods: We implemented the dashboard using Power BI and conducted four PDSA cycles targeting biomarker-based risk groups. Families received a one-time phone call or were scheduled for a series of problem-solving calls.
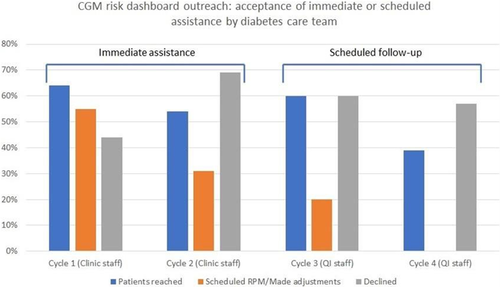
Results: Figure 1 shows the results of telephone outreach across four PDSA cycles. 33% of patients were flagged based on out-of-date CGM data, had already transitioned to adult care, or had time in range >80% despite meeting other risk biomarkers. These issues affecting efficient workflow and patient acceptability were addressed after Cycle 2. Subsequently, 0% of patients who were reviewed in the dashboard were affected by these issues. Overall, families were more engaged in making insulin changes at the point of contact than when scheduling a series of future remote contacts.
Conclusions: A CGM-based risk dashboard may help clinicians identify patients who would benefit from proactive outreach between in-clinic visits, but families may be difficult to reach by phone, and some families may not perceive that they need help. Future work should seek to overcome these barriers.
Keywords: CGM, diabetes, population health management