Abstract: Examining the Glycemia Risk Index (GRI) as a Risk Biomarker for Elevated hemoglobin A1c in Individuals with Type 1 Diabetes (T1D)
B. Lockee1, J. Litwin1, C. Vandervelden1, D. Williams2, M. Barnes1, R. Mcdonough3, S. Patton4, K. Noland1, M. Clements5
1Children’s Mercy Hospital, Endocrinology, Kansas City, United States of America, 2Children’s Mercy Hospital, Health Services and Outcomes Research, Kansas City, United States of America, 3Children’s Mercy-Kansas City, Endocrinology, Kansas City, United States of America, 4Nemour’s Children’s Health, Center for Healthcare Delivery Science, Jacksonville, United States of America, 5Children’s Mercy Hospital, Endocrinology and Diabetes, Kansas City, United States of America
Background and Aims: The Glycemia Risk Index (GRI) is a new metric for interpreting the quality of glycemic control using CGM data. The GRI has two main components: risk from high blood sugars and risk from lows. We examined the relationship between GRI and future HbA1c levels to evaluate the validity of GRI as a prognostic tool to provide a more complete picture than time in range (TIR).
Methods: We retrospectively analyzed 12-week CGM data aggregates preceding an HbA1c assessment date using data collected at a Midwest pediatric diabetes center between 2016-2022. We performed bivariate correlations and multivariable linear regressions to evaluate associations between GRI (and its components) and most recent HbA1c value for patients who had a wear time >50% (N = 994).
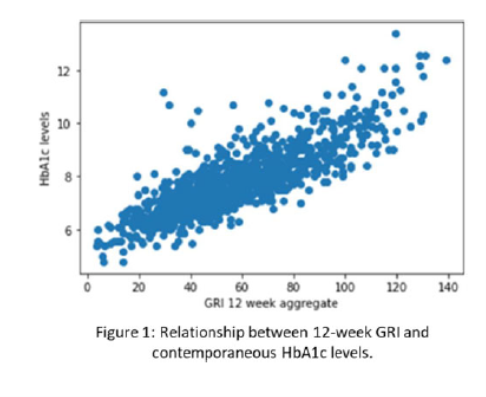
Results: Both the GRI and GRI high component positively correlated with HbA1c levels (r = 0 .819 and r = 0.832 respectively, p < 0.001), which had a correlation of similar magnitude with TIR (r = -0.817, p < 0.001). The GRI low component negatively correlated with HbA1c (r = -0.269, p < .001). We ran two regression models (N= 993) with HbA1c levels as the dependent variable: one including age, gender, race, ethnicity, insurance type, diabetes duration, and GRI high component as explanatory variables (r2 = .700) and one with only the GRI high component (r2 = .694).
Conclusions: Reporting the GRI with CGM data may provide a more complete picture of the quality of a youth’s glycemic control than TIR. Further testing is needed to determine if GRI improves clinician risk assessment for glycemic outcomes beyond those provided by TIR.