Abstract: Assessment of the glycemia risk index as metric for evaluating quality of glycemia in youths with type 1 diabetes
E.M. Tallon1, K. Panfil1, C.A. Vandervelden1, B. Lockee1, D.D. Williams1, M. Barnes1, S. Patton2, C. Schweisberger1, R. McDonough1, D. Klonoff3, M. Clements1
1Children’s Mercy, Endocrinology, Kansas City, United States, 2Nemours Children’s Health, Jacksonville, United States, 3Mills-Peninsula Medical Center, San Mateo, United States
Introduction: The Glycemia Risk Index (GRI), a composite metric that condenses an individual’s quality of glycemia into a single number, has been validated in adults with Type 1 diabetes (T1D). The GRI is calculated using weighted metrics from the Ambulatory Glucose Profile (AGP): (1) % time spent in low- and very low-glucose hypoglycemia and (2) % time spent in high- and very high-glucose hyperglycemia.
Objectives: In a cohort of youths with T1D, we evaluated:
- Proportions of youth in GRI Grid-defined glycemia risk zones/quintiles, and;
- Correlations between the GRI and youths’ AGP metrics.
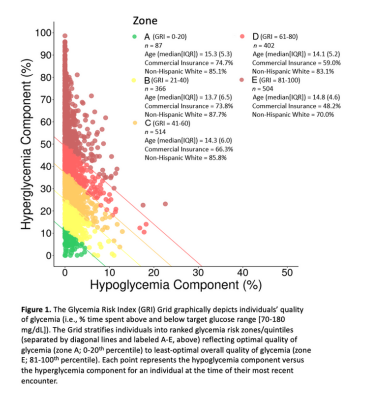
Methods: We retrospectively analyzed continuous glucose monitor (CGM) data from youth receiving care at a network of pediatric diabetes clinics in the Midwest USA. Our cohort included 1,873 youths with T1D (49.8% female; median (IQR) age, 13.3 (5.4) years; 73.8% insulin pump users). We assessed youths’ GRI scores (median [IQR], 56.4 [38.1]) on a two-dimensional GRI Grid. The Grid depicts individuals’ quality of glycemia and stratifies individuals into ranked glycemia risk zones/ quintiles (labeled A-E) reflecting optimal (zone A) to least-optimal (zone E) overall quality of glycemia. We also evaluated correlations between the GRI and various AGP metrics.
Results: Proportions of youths in glycemia risk zones A-E, respectively, were 4.6%, 19.5%, 27.4%, 21.5%, and 26.9% (Figure 1). The GRI correlated negatively with % time in target glucose range (70-180 mg/dL; r= -0.97); it correlated positively with % time in high- (181-250 mg/dL; r= 0.94) and very high- (>250 mg/dL; r= 0.96) glucose hyperglycemia. The GRI was not highly correlated with % time in low- (54-69 mg/dL; r= -0.05) or very low- (<54 mg/dL; r=0.10) glucose hypoglycemia.
Conclusions: In youth with T1D, the GRI is more impacted by time spent in hyperglycemia versus hypoglycemia. GRI score distributions in this population suggest opportunities for using CGM-derived composite metrics to improve youths’ quality of glycemic control.
Link: https://www.react-profile.org/upload/KIT/system/uploads/ISPAD2023_Abstracts.pdf